Sick Leave Statistics in Germany: The Key Numbers (2026 Edition)

Blasko Sarcevic
Published · Updated
How high sickness absence in Germany really is, which diagnoses drive it, what it costs, and why the numbers jumped after 2022. The core statistics with sources, for HR reports and workforce planning.
Topic

Topic: sickness absence in numbers.
How high is sickness absence in Germany?
German employees were recently sick-listed for around 15 working days per year on average (Federal Statistical Office), up from roughly 11 days before the pandemic. The Krankenstand rate reported by public health insurers (the share of insured workers off sick on a given day) has hovered around 5 to 5.5 percent since 2022, a record level. Three diagnosis groups dominate: respiratory infections (most frequent, mostly short), musculoskeletal disorders (second), and mental health conditions, the latter with by far the longest absences, averaging over 30 days per case and rising for years. Part of the post-2022 jump is a recording effect: since electronic sick notes (eAU) became mandatory, every certificate reaches the insurers' data, where paper notes previously went unreported. Economically, the BAuA estimates the production loss from sickness absence at a three-digit billion-euro figure per year.
The core numbers at a glance
Sources measure sickness absence differently: the statistical office surveys employees, insurers count certified absence days of their members. The magnitudes agree: record highs.
| Metric | Value (rounded) | Source |
|---|---|---|
| Sick days per employee per year | about 15 working days | Federal Statistical Office (Destatis) |
| Krankenstand rate (share off sick on a given day) | about 5 to 5.5% | DAK / TK health reports |
| Certified absence days per insured worker per year | about 19 to 20 days | TK health report |
| Average duration per mental-health case | over 30 days | DAK Psychreport |
| Production loss from sickness absence | three-digit billions of euros / year | BAuA |
What drives the absence rate
The diagnosis ranking has been stable for years, but the weights are shifting noticeably:
- Respiratory infections: the most frequent single cause, many short cases, shapes the winter infection waves.
- Musculoskeletal disorders: the second-largest block, typical for physical jobs, medium case durations.
- Mental health conditions: third by total days but by far the longest cases, and the fastest-growing category.
- Industry gaps are wide: care work, education, and logistics sit well above average; knowledge-work office roles below.
The eAU effect: why the curve jumps in 2022
Since 2022/2023, doctors transmit sick notes electronically to the insurers (eAU). That captures certificates that previously never reached the insurer on paper, so part of the record level is better recording, not only more sickness.
For HR this means: comparisons against pre-2022 values are of limited use. Benchmark your own absence rate against current industry values, not historical time series.
What sickness absence costs
For German employers the direct cost block starts with continued pay: up to six weeks of full salary per sickness case (Section 3 EFZG), after which the insurer pays sickness benefit. Cover staff, overtime, and friction come on top.
Economy-wide, the BAuA puts the production loss from sickness absence at a three-digit billion-euro figure per year; including lost gross value added, the estimate is substantially higher.
The US comparison
The US has no federal paid-sick-leave law; mandates come from individual states and employers. Workers with access receive about 7 to 8 paid sick days per year on average (BLS), and reported absence is far below German values, partly because unreported working-while-sick is common.
For international teams the lesson is: absence benchmarks do not translate across countries: The systems measure different things. Our state-by-state sick leave reference lists the US mandates.
For HR: measure your own curve
Public statistics answer the benchmark question. Your own curve comes from the absence system: sick days per team and month, case durations, seasonality. Clean separation by leave type matters, otherwise vacation and special leave dilute the metric.
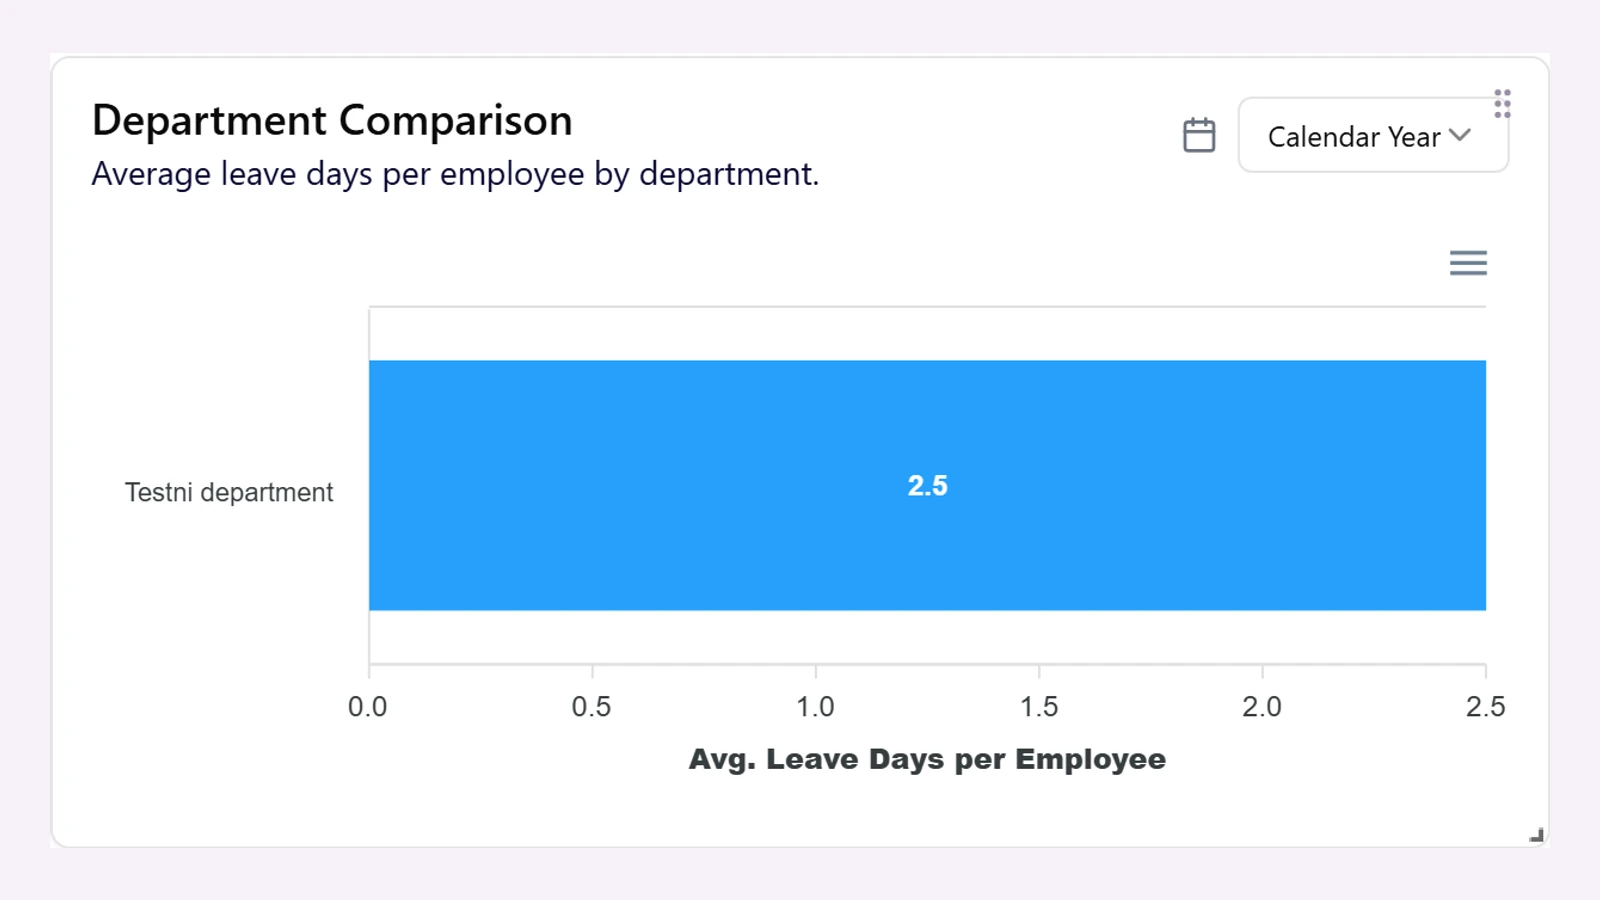
Time Out Zone tracks sick leave as its own leave type and makes it reportable per department in charts and exports, including year-over-year trends.
Methodology: where these numbers come from
This page collects no data of its own. It compiles 8 metrics from public sources, names the source for each one, and publishes the compilation as a downloadable CSV. Last checked in full against the sources on 2026-07-20.
One thing matters before you reuse the figures: the sources do not measure the same thing. The statistical office surveys employees, while the health insurers count certified absence days of their own members. That is why about 15 working days sits next to about 19 to 20 certified days without either number being wrong. If you use both in one report, state the definition alongside them.
Values are given as ranges wherever the sources publish ranges. Converting them to a single figure would be more precise than the reporting supports. The reference-period column in the dataset says 'latest reported year' rather than naming a calendar year, because the reports appear on different schedules.
- Out of scope: individual company data, industry breakdowns below the major reports, and forecasts.
- The six weeks of continued pay is law in force (Section 3 EFZG), not a statistic, so it carries no reference period.
- The US comparison figure is from the Bureau of Labor Statistics and covers only employees who have access to paid sick days.
Sources: German Federal Statistical Office (Destatis), BAuA report 'Safety and Health at Work', DAK and TK health reports, gesund.bund.de; US comparison from BLS benefits data. Figures are rounded and definitions differ between sources (insurer data vs. surveys); check the original source before citing.
Frequently asked questions
- How many sick days per year are normal in Germany?
- The current average is around 15 working days per employee per year (Destatis), with large differences by industry, age, and occupation. Before the pandemic it was about 11 days.
- What exactly is the Krankenstand rate?
- A ratio: the share of insured workers reported unfit for work on a given day: currently around 5 to 5.5%. It differs from absence days per head, which sum certified days over the year.
- Why did German sickness absence jump after 2022?
- Three factors: strong infection waves, the long-term rise of mental-health absences, and the eAU recording effect: Electronic sick notes capture every certificate since 2022, where paper notes previously went unreported.
- How does Germany compare to the US?
- Not directly: Germany mandates up to six weeks of full continued pay per case, while the US has no federal paid-sick-leave law and state mandates typically cap at 40 to 72 hours per year. The systems record different things.
About the author
Blasko Sarcevic
Founder, Time-Out Zone
Connect on LinkedIn Connect on LinkedIn
Blasko writes about leave management, policy design, and running time-off operations at scale.
Related
Track and report sick leave cleanly
Time Out Zone separates sick leave from vacation, shows trends per department, and delivers the reports HR and leadership ask for.