Analytics overview
The admin dashboard has two reporting surfaces: the "Analytics" tab for interactive charts and the "Reports" tab for downloadable or scheduled exports. Both cover the whole company and are admin permissions. Managers work with their own Audit tab instead.
Analytics answers "what is happening?" at a glance; Reports produces the files HR, finance, and auditors ask for.
The Analytics tab
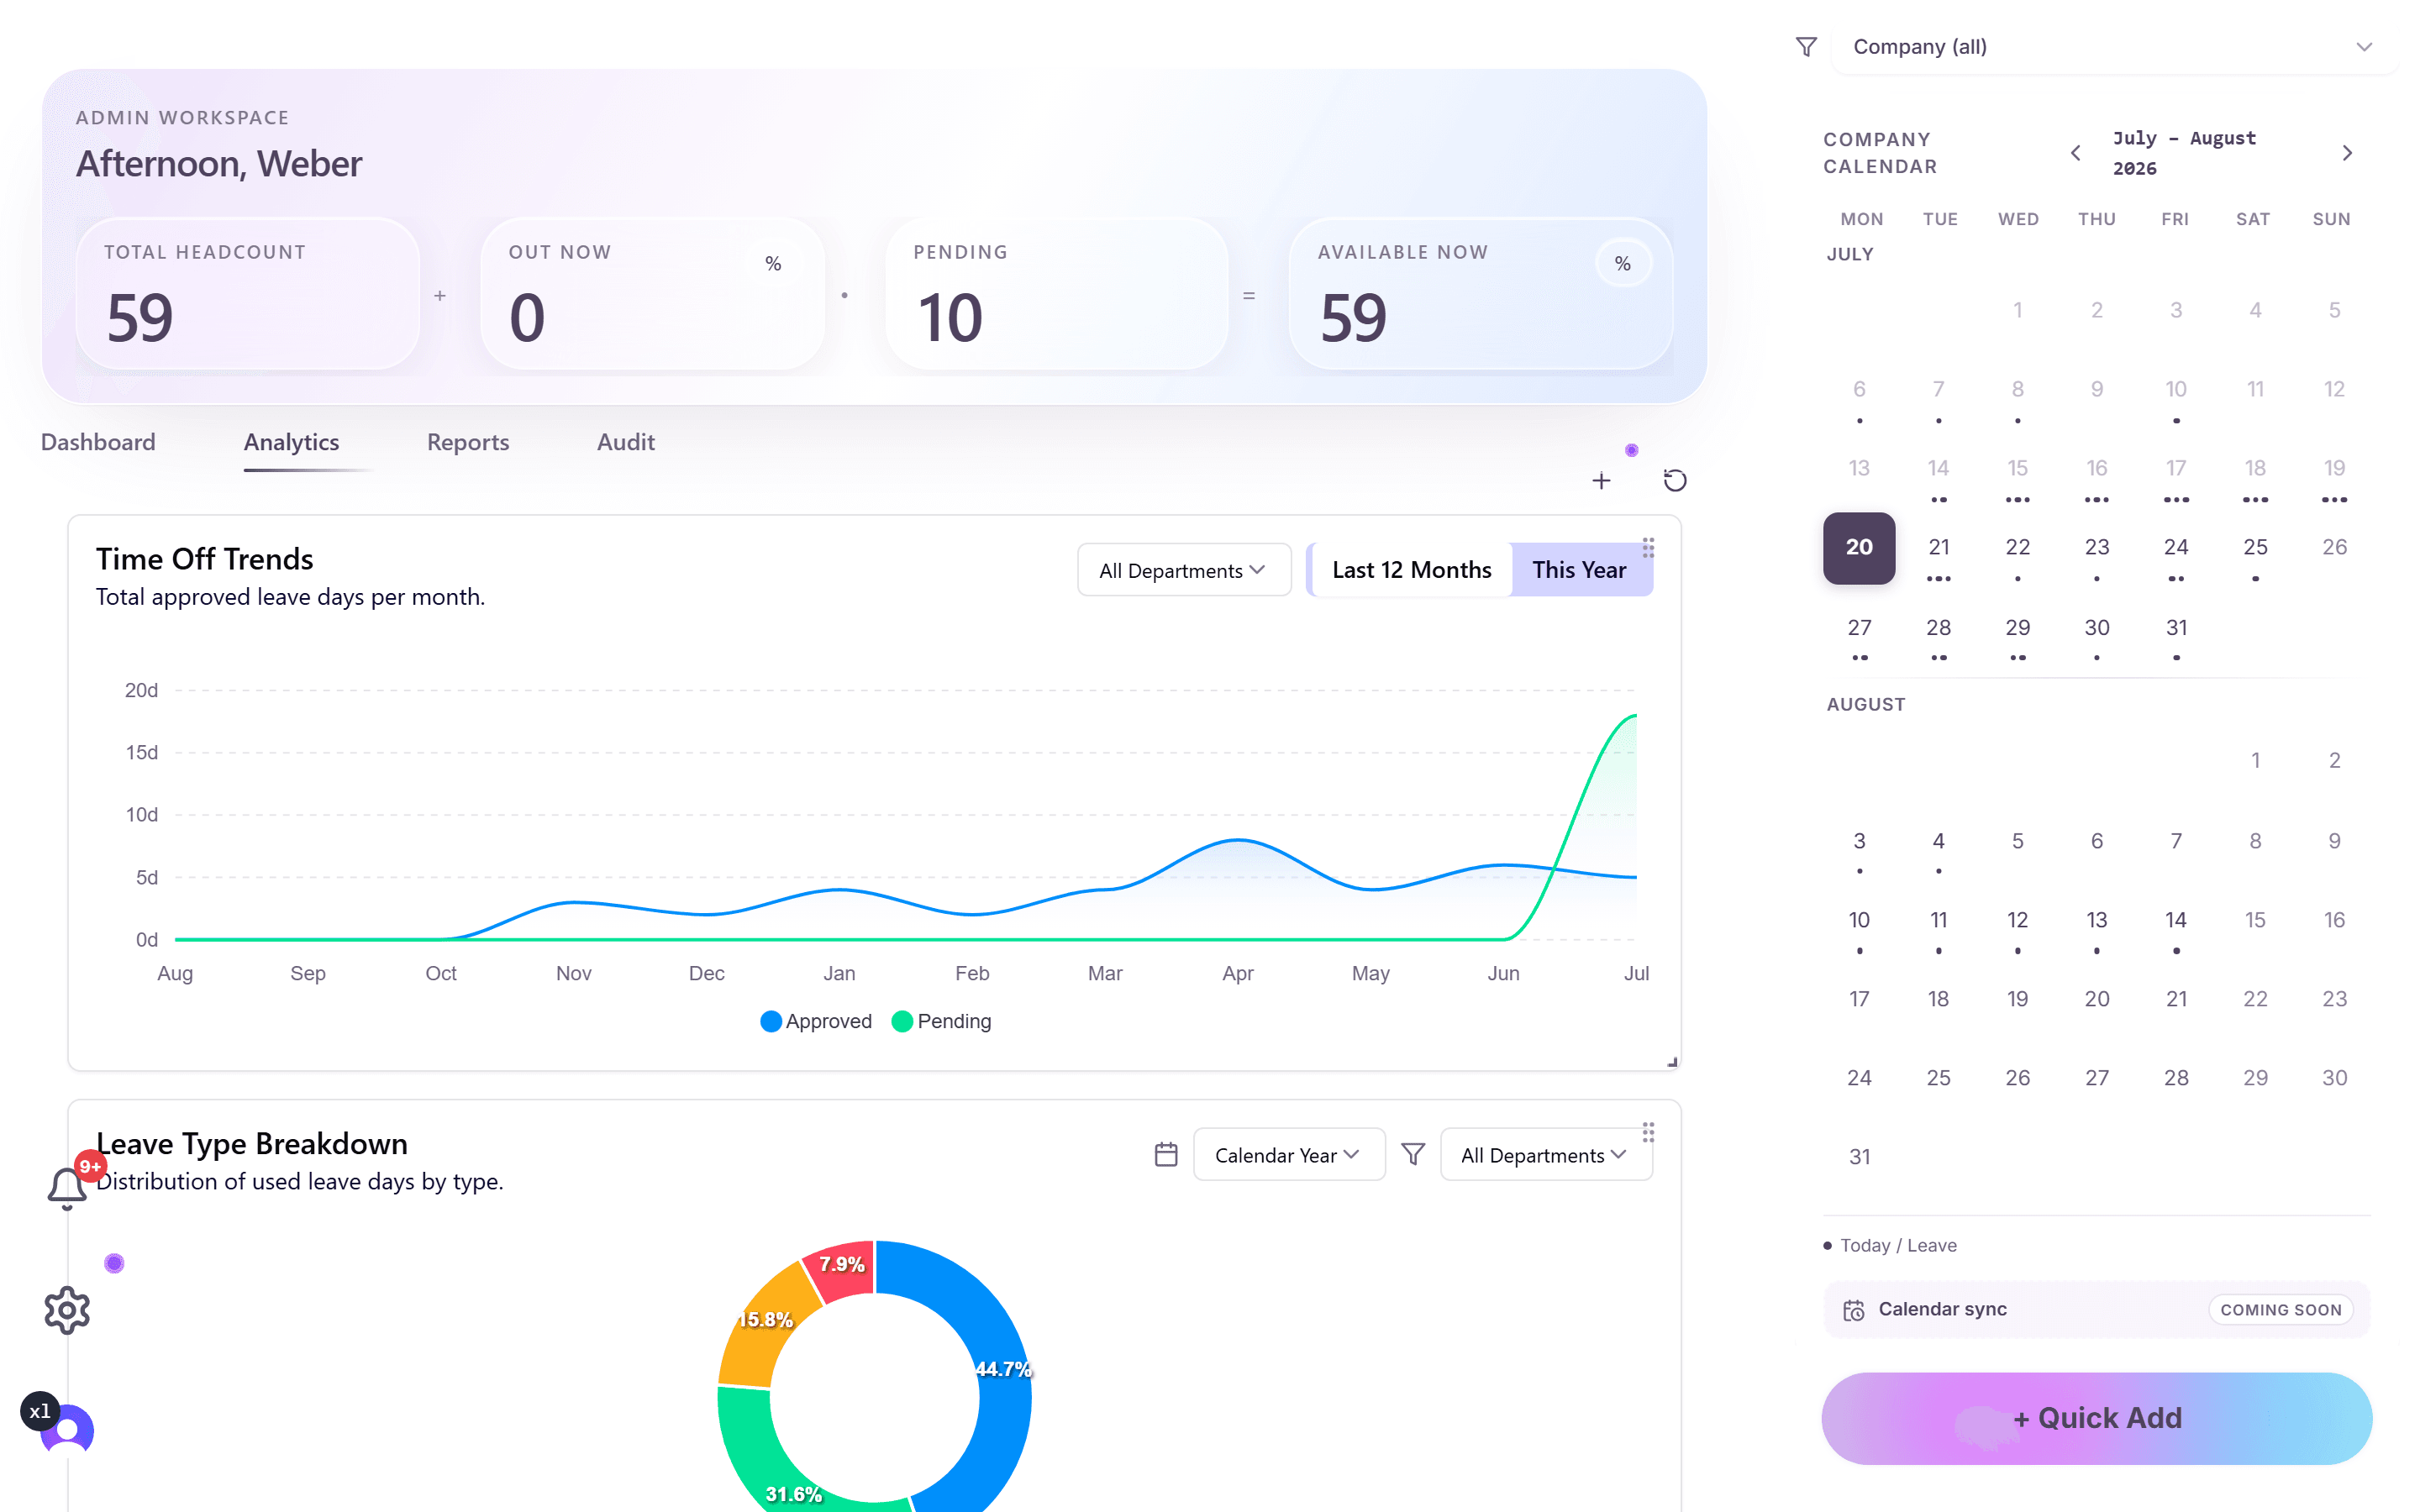
Charts are picked from a gallery (categories "Usage", "Distribution", "Trends", "Comparison") and arranged by drag and drop. Your layout is saved. The available charts:
- "Time-Off Trends": approved and denied requests over the last 30 days.
- "Leave Type Breakdown": how used days distribute across leave types.
- "Department Comparison" and "Headcount by Department".
- "Leave Heatmap": absence density per day and month across the year.
- "Leave Utilization": percentage of allocated days used, per leave type.
- "Approval Turnaround": how long approvals take, as a histogram.
- "Balance Distribution": employees grouped by percentage of leave used.
- "Year-over-Year": approved days per month, this year against last.
- "Top Requesters": the ten people with the most approved leave days.
Several charts have their own department filter ("Select Department" / "All Departments"). Filters are per chart, not one global toolbar.
The Reports tab
- Open "Reports" and use the "Generate a New Report" card.
- Pick the "Report Type": from "PTO Usage Summary" and "Accrual History" through "Department Summary", "Team Absence Calendar", "Payout Report", and "Compliance Gap Analysis" to informational exports like "Balance Snapshot", "Negative Balance Report", "Policy Assignment Report", and "Opening Balance Import Summary".
- Set the filters the type supports: "Date Range", "Department", "Employee", or "Team" (the Team Absence Calendar requires a team and covers up to 31 days).
- Choose the format: "CSV", "PDF", or "Excel (.xlsx)", and click "Generate Report".
Scheduling and history
- "Schedule this report" turns a one-off into a recurring e-mail: pick the "Frequency" and "Recipient Emails"; active schedules appear under "Scheduled Reports".
- "Report History" lists everything generated, with the type, format, and a download control: no regenerating for a file you made last week.
Informational exports say it themselves: "Informational export only. Use it for HR, finance, or audit review, not as a direct payroll sync." There is no payroll integration behind them.
Frequently asked questions
- Can managers see the Analytics tab?
- No, Analytics and Reports are admin surfaces. Managers have read access to reports data through their own dashboard scope and the Audit tab with its CSV and Excel export.
- Which report shows compliance risk?
- "Compliance Gap Analysis" compares each location's policy days against the configured legal minimum and flags gaps, with the compliance source per location.
- Is there a custom report builder?
- No, the ten report types cover the standard questions. If a type almost fits, generate it as CSV and refine in a spreadsheet; the columns are stable and machine-friendly.